I led the UX/UI design of this platform in collaboration with another designer. I was responsible for user research, wireframes, prototyping, UI design, and building a scalable design system.

1. Discover & Define
Met with stakeholders to understand their goals and user types (e.g. analysts, clerks, journalists).
Analyzed the structure of the existing data (PDFs, tables, charts).
Defined key user needs: fast filtering, clear comparison, intuitive navigation.
2. Ideate & Validate
Sketched early wireframes and created mid-fidelity prototypes.
Conducted feedback sessions with stakeholders.
Refined based on input—users needed clearer visual hierarchy, simpler filters, and a guided starting point.
3. Final Design
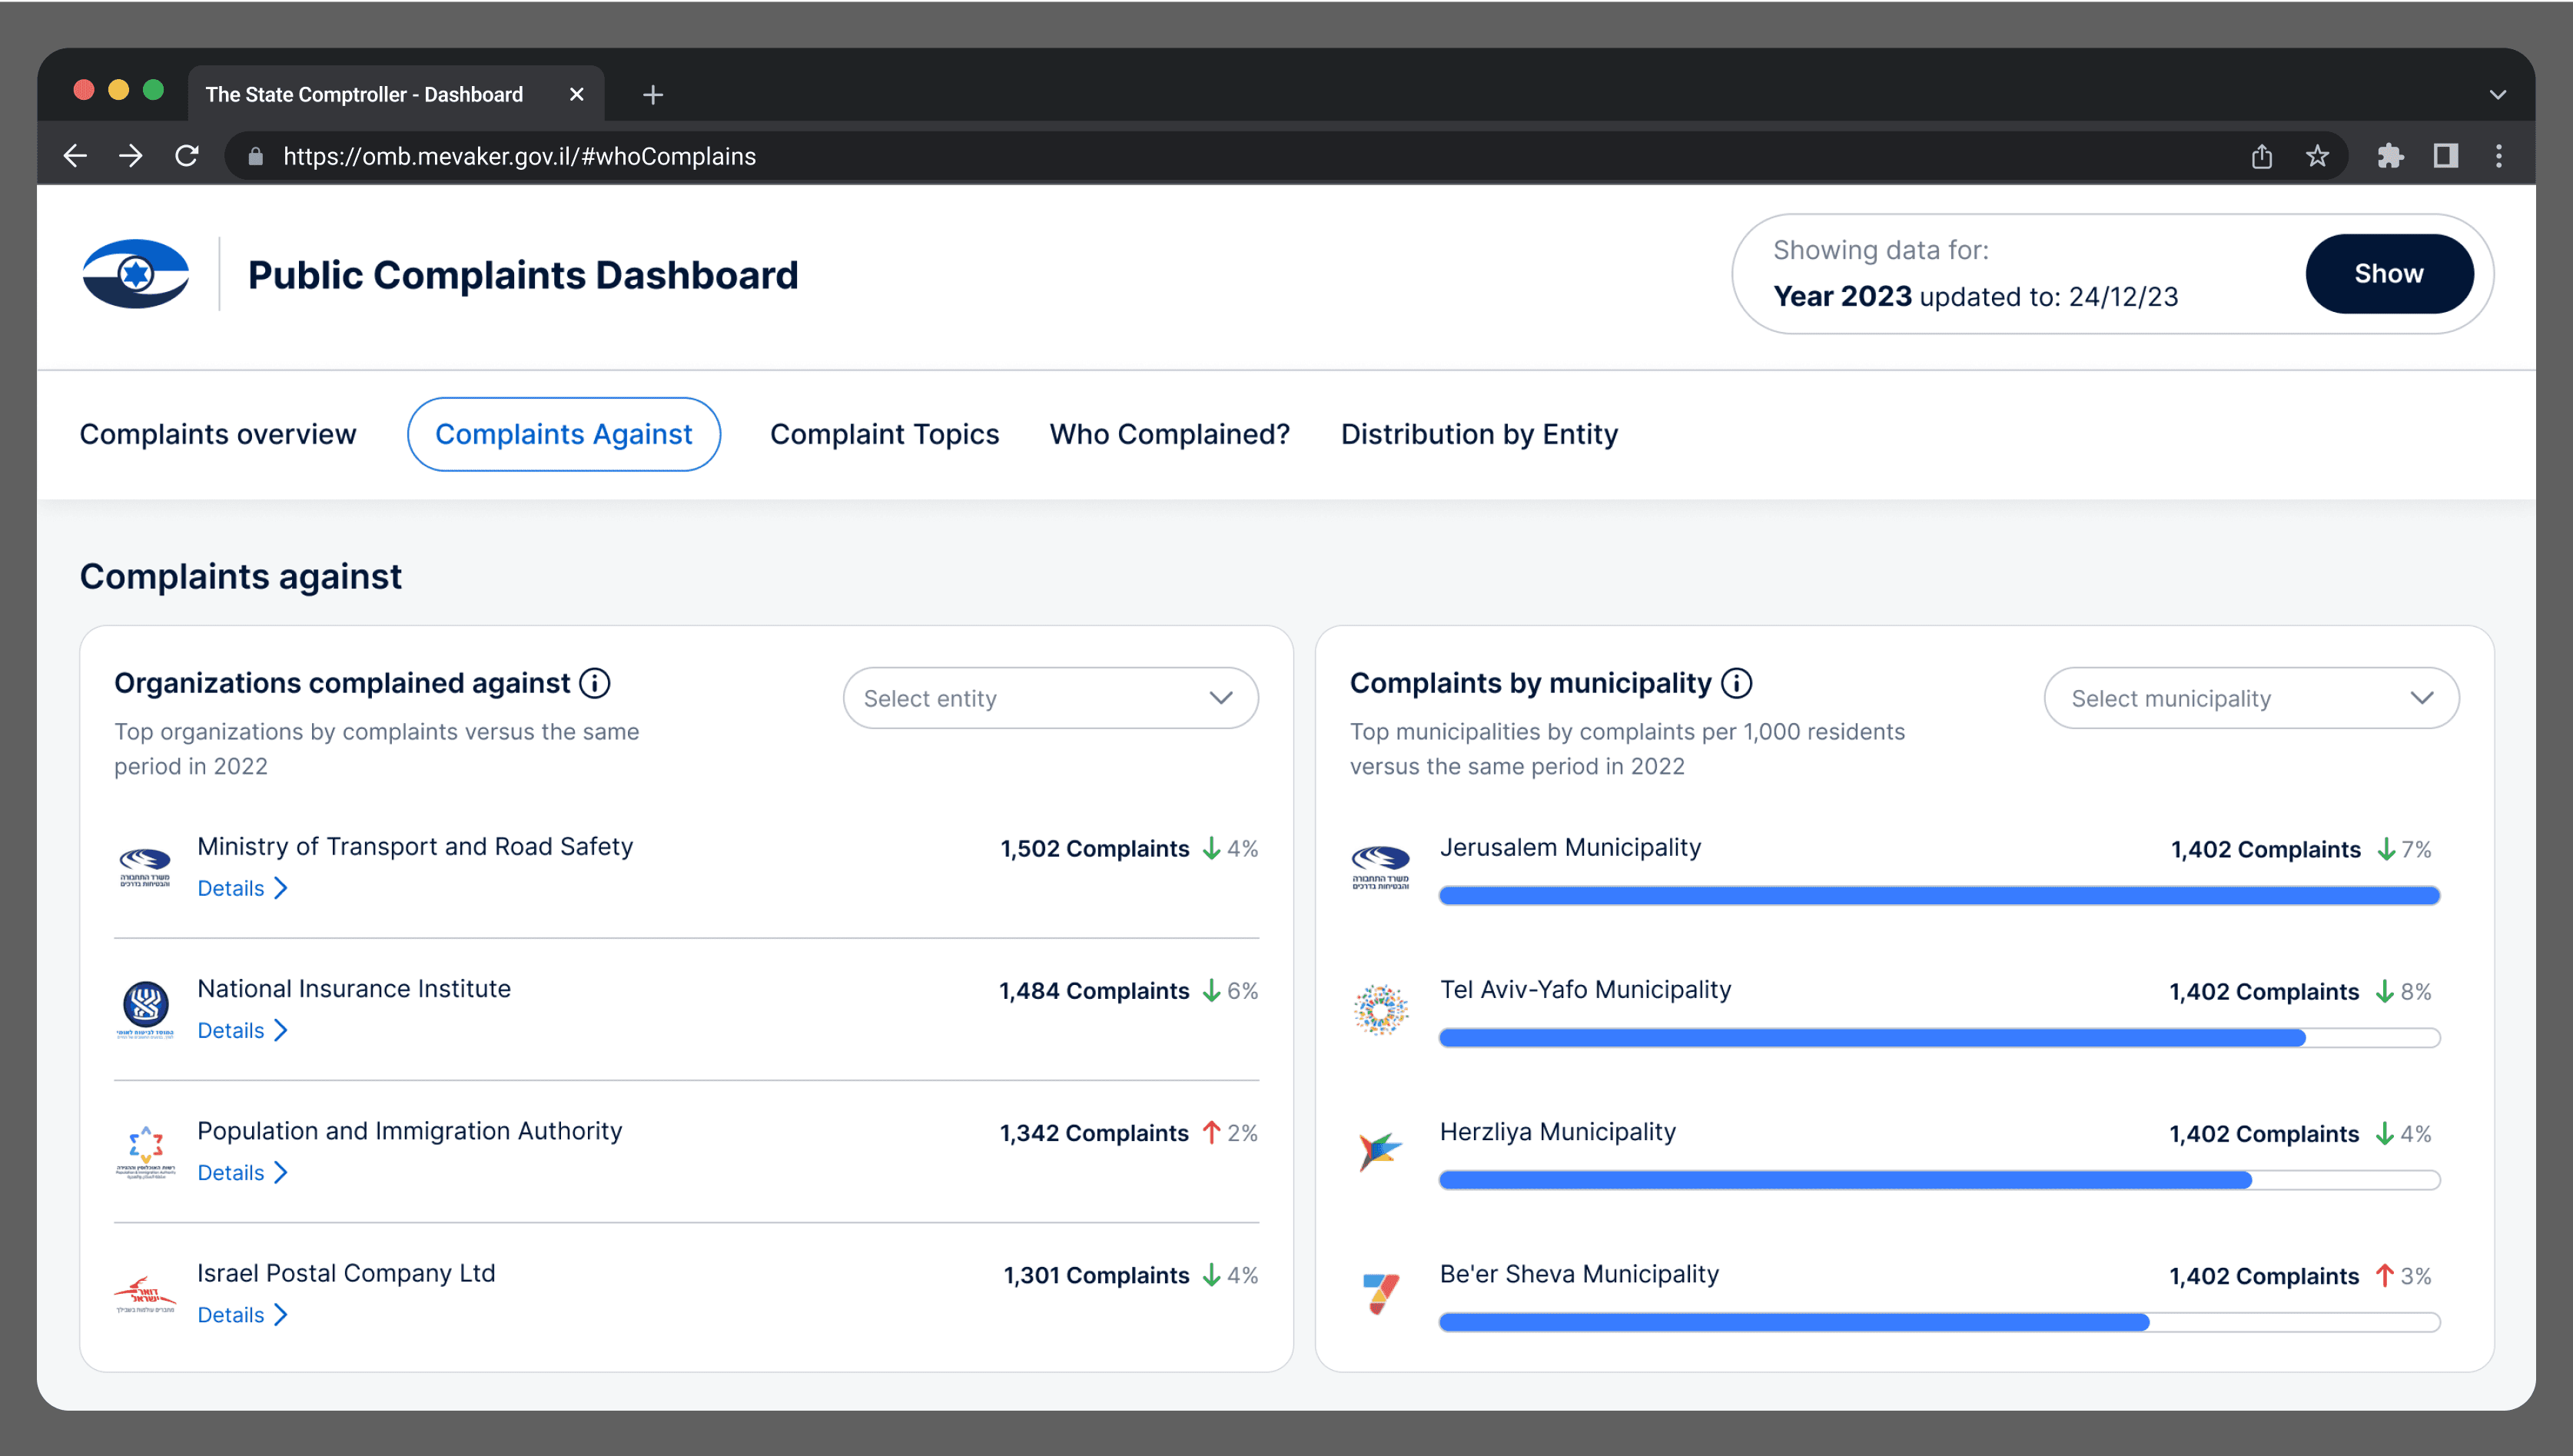
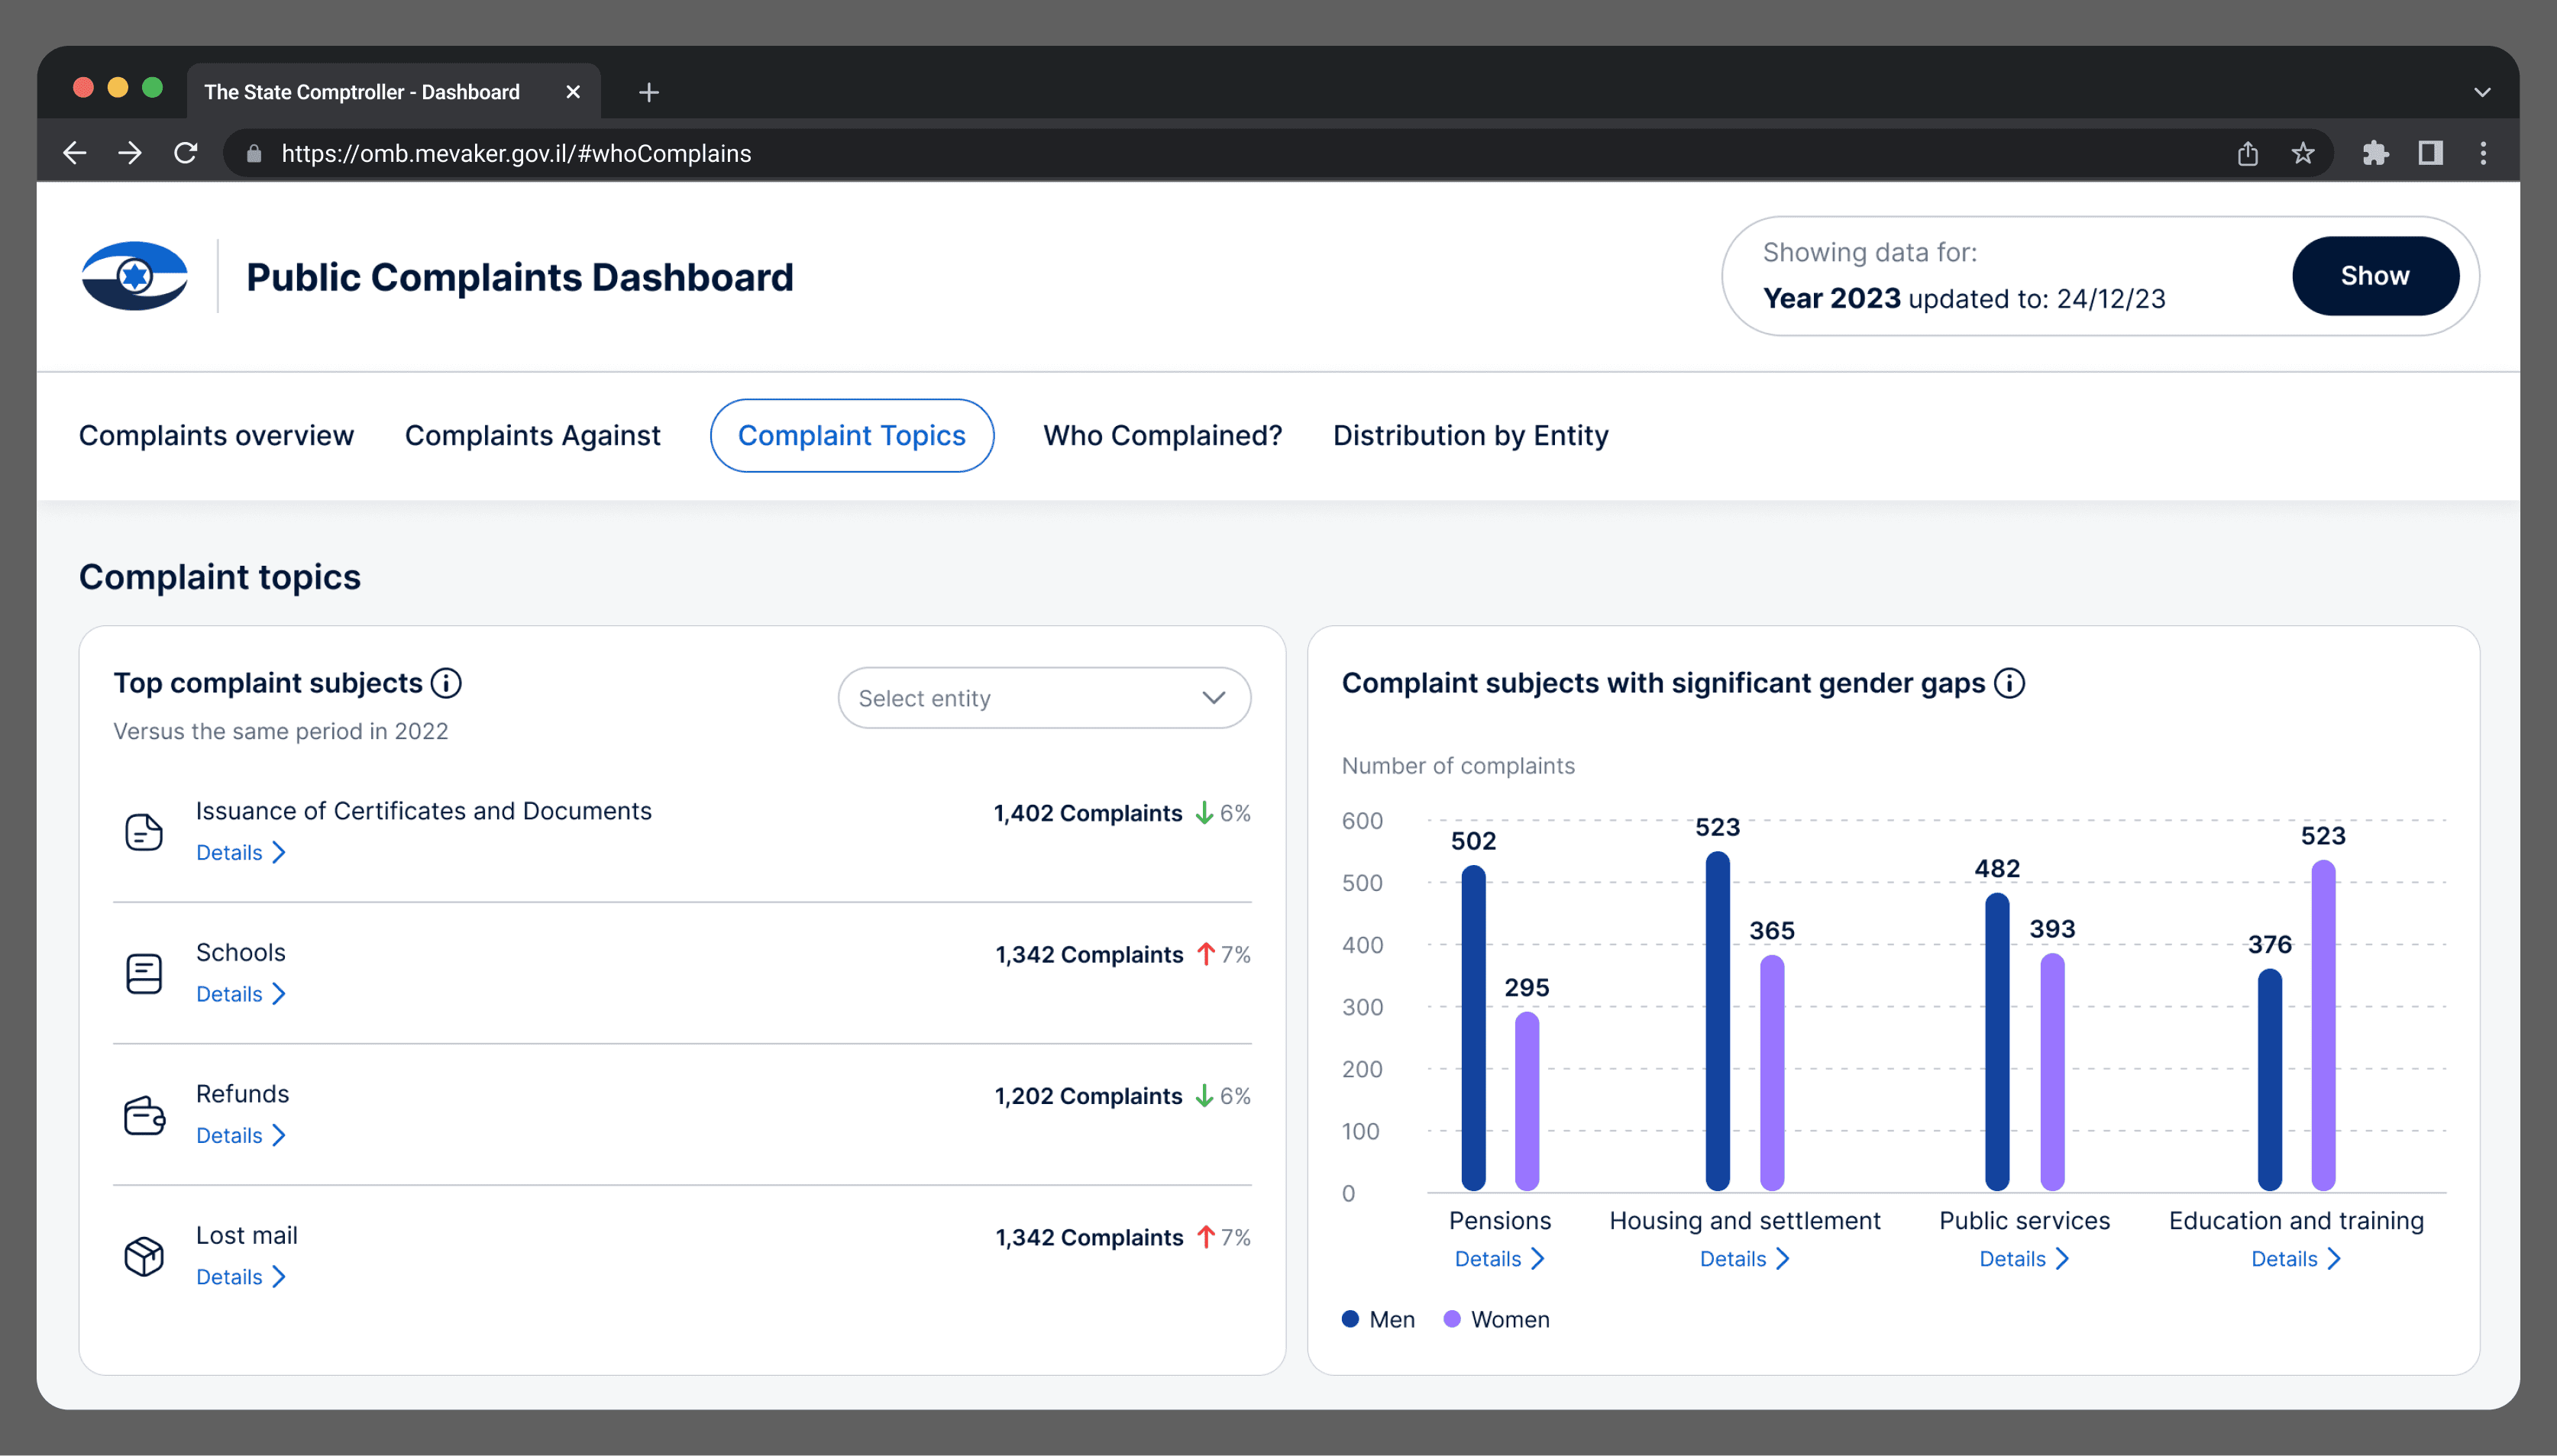
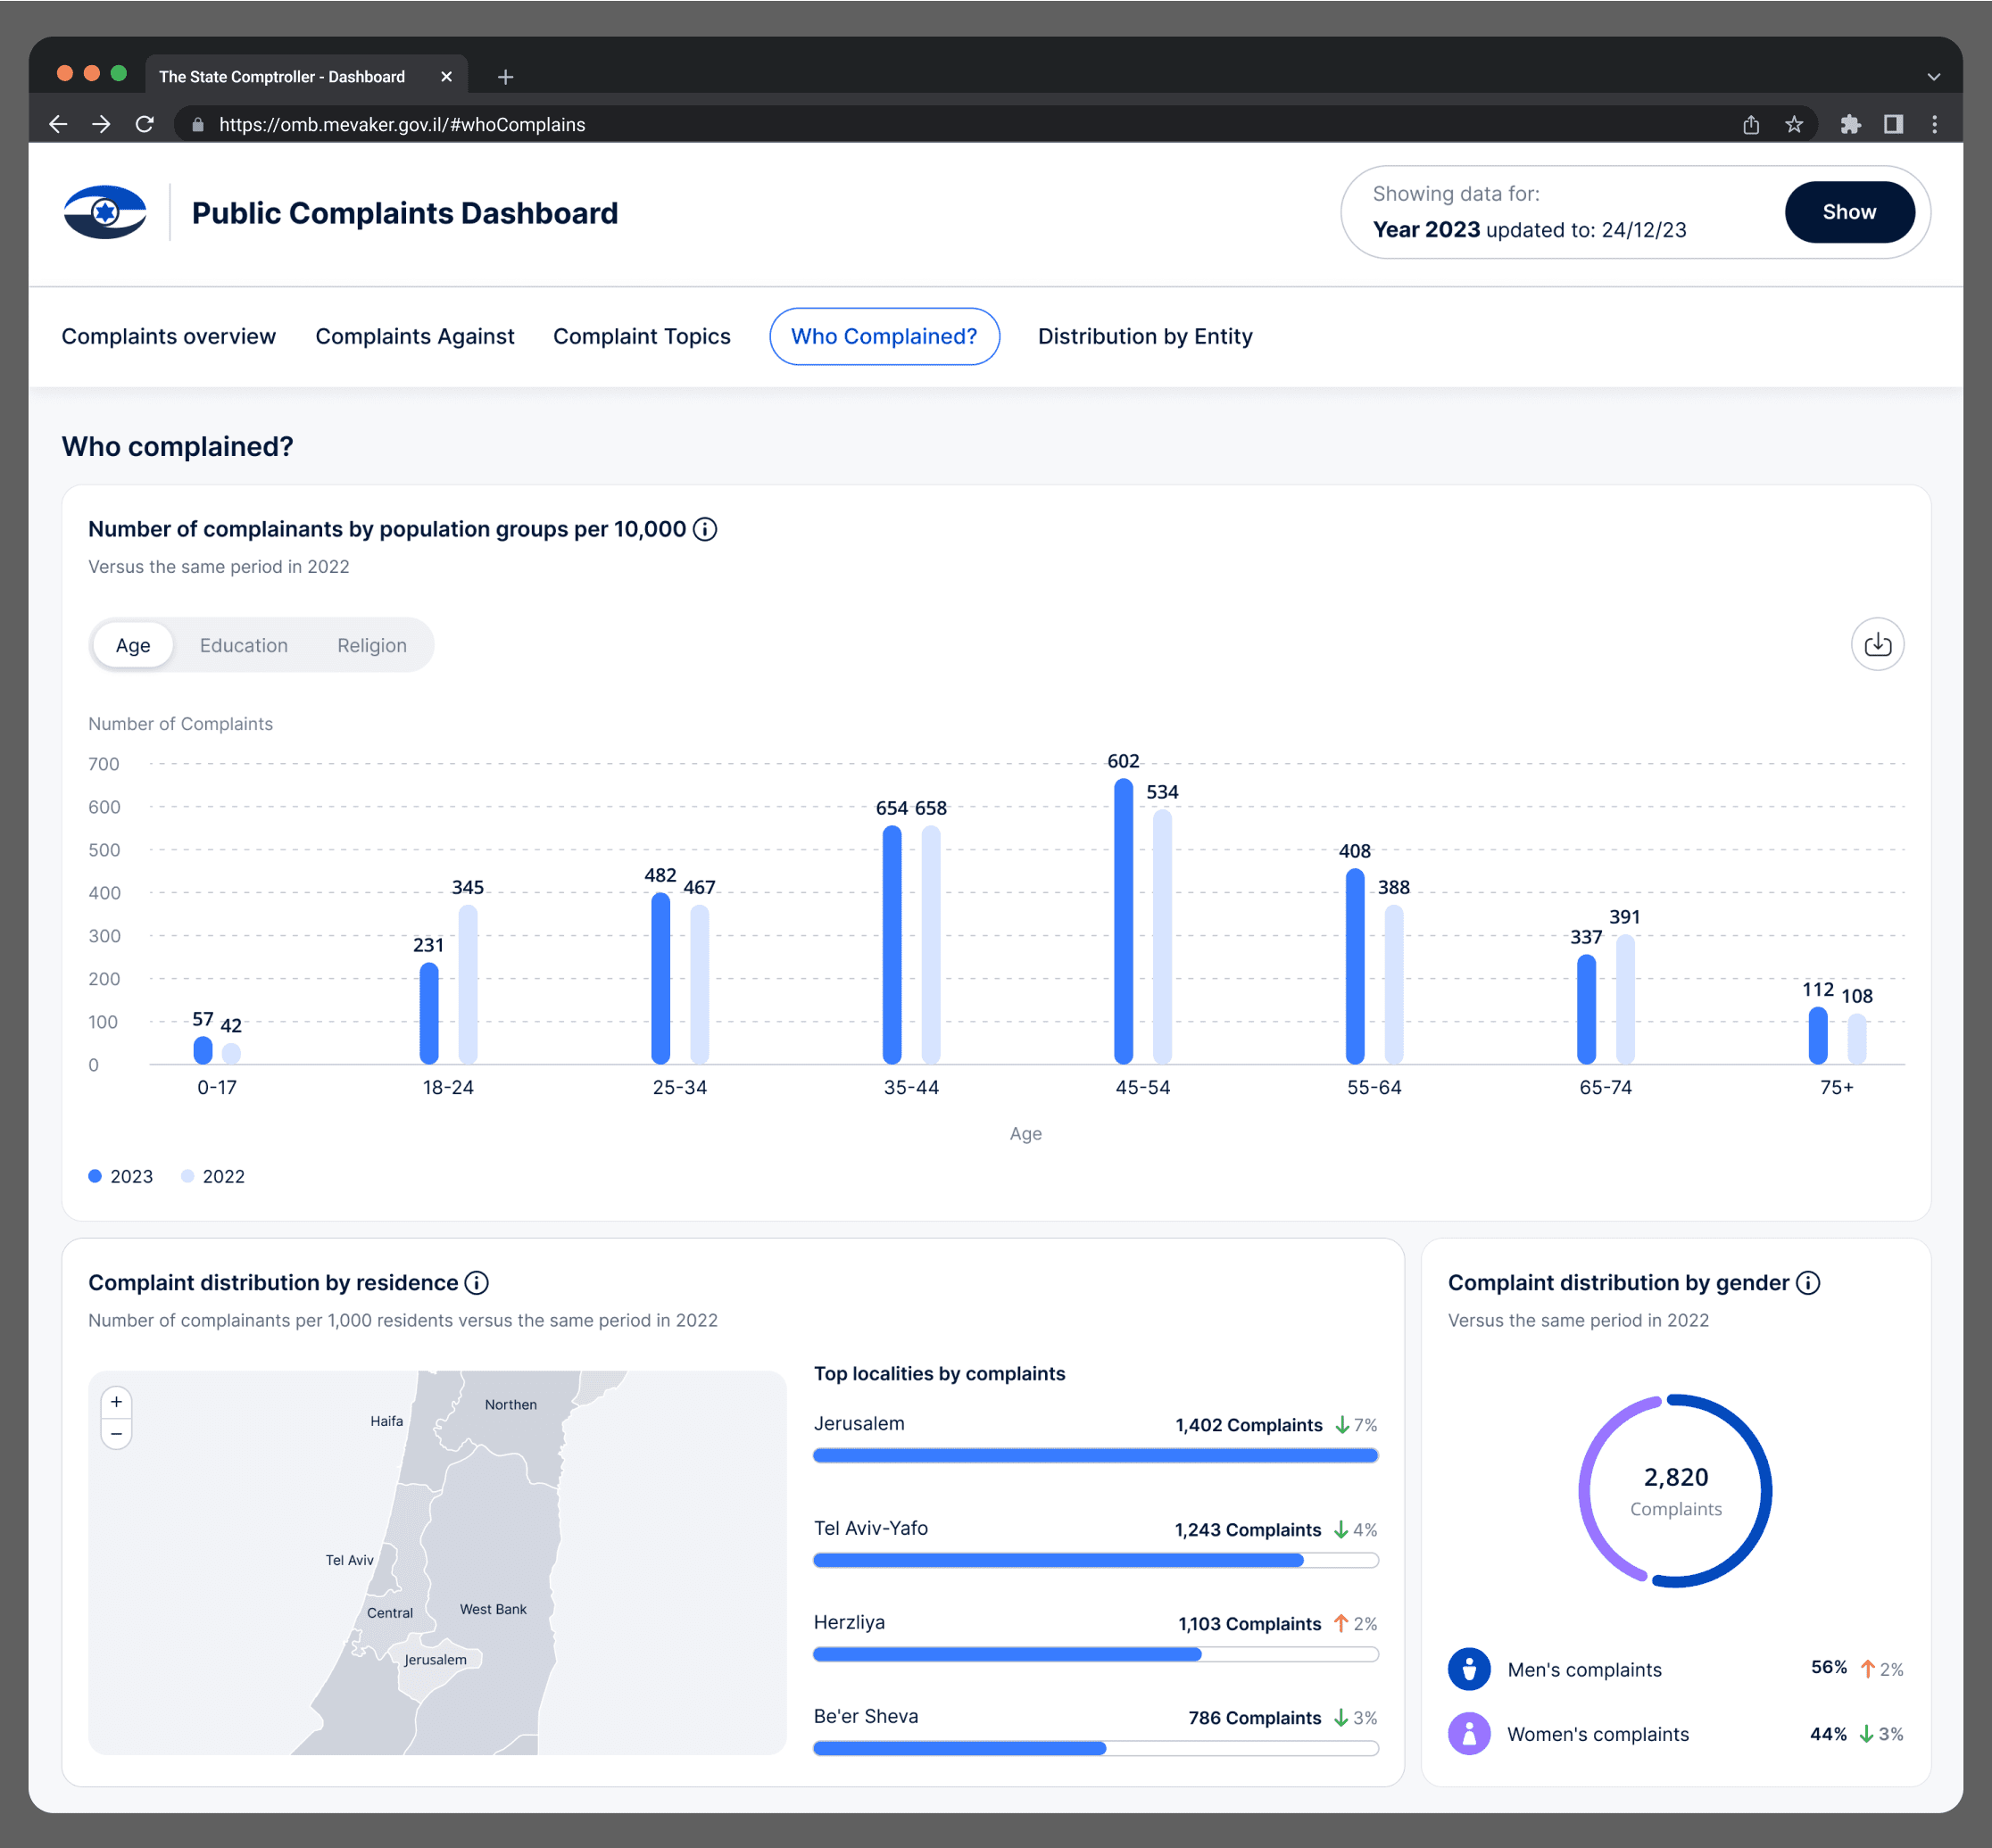
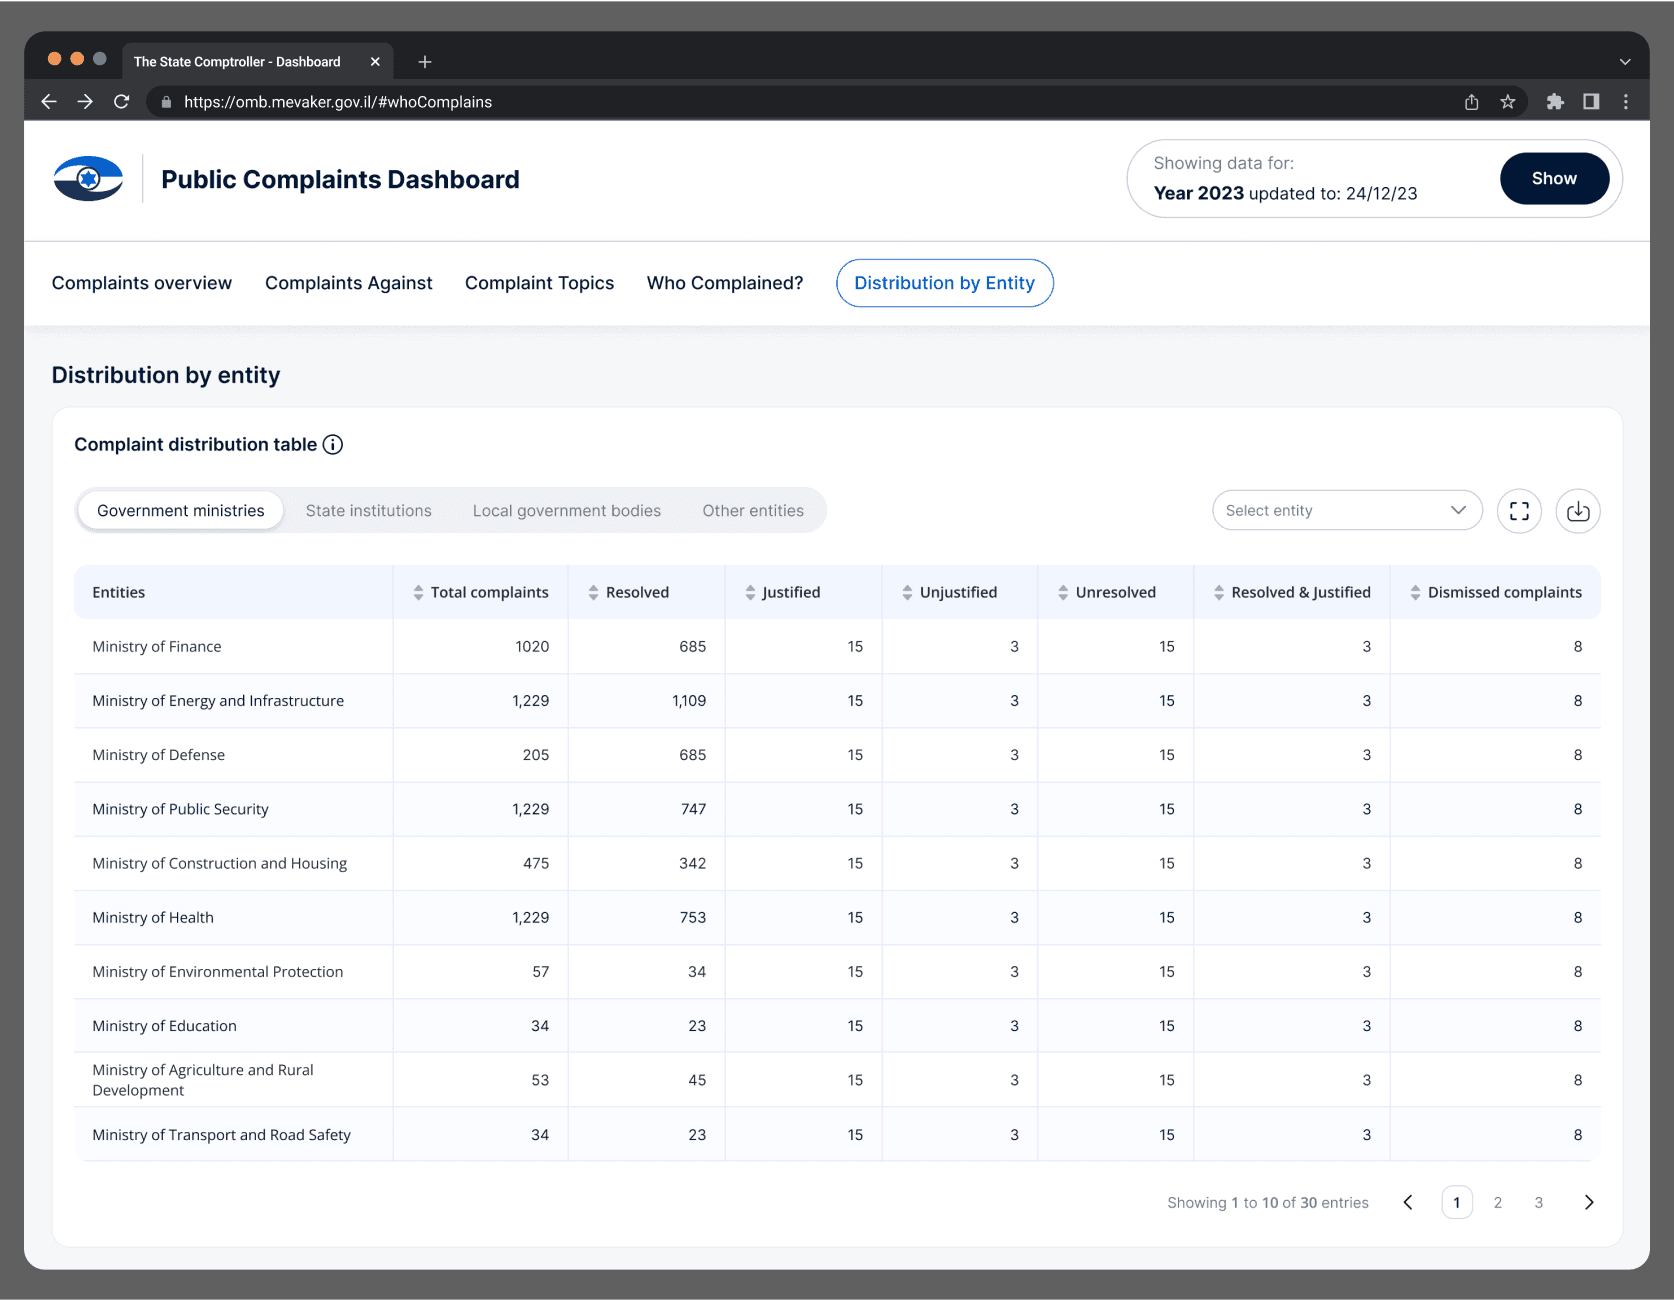
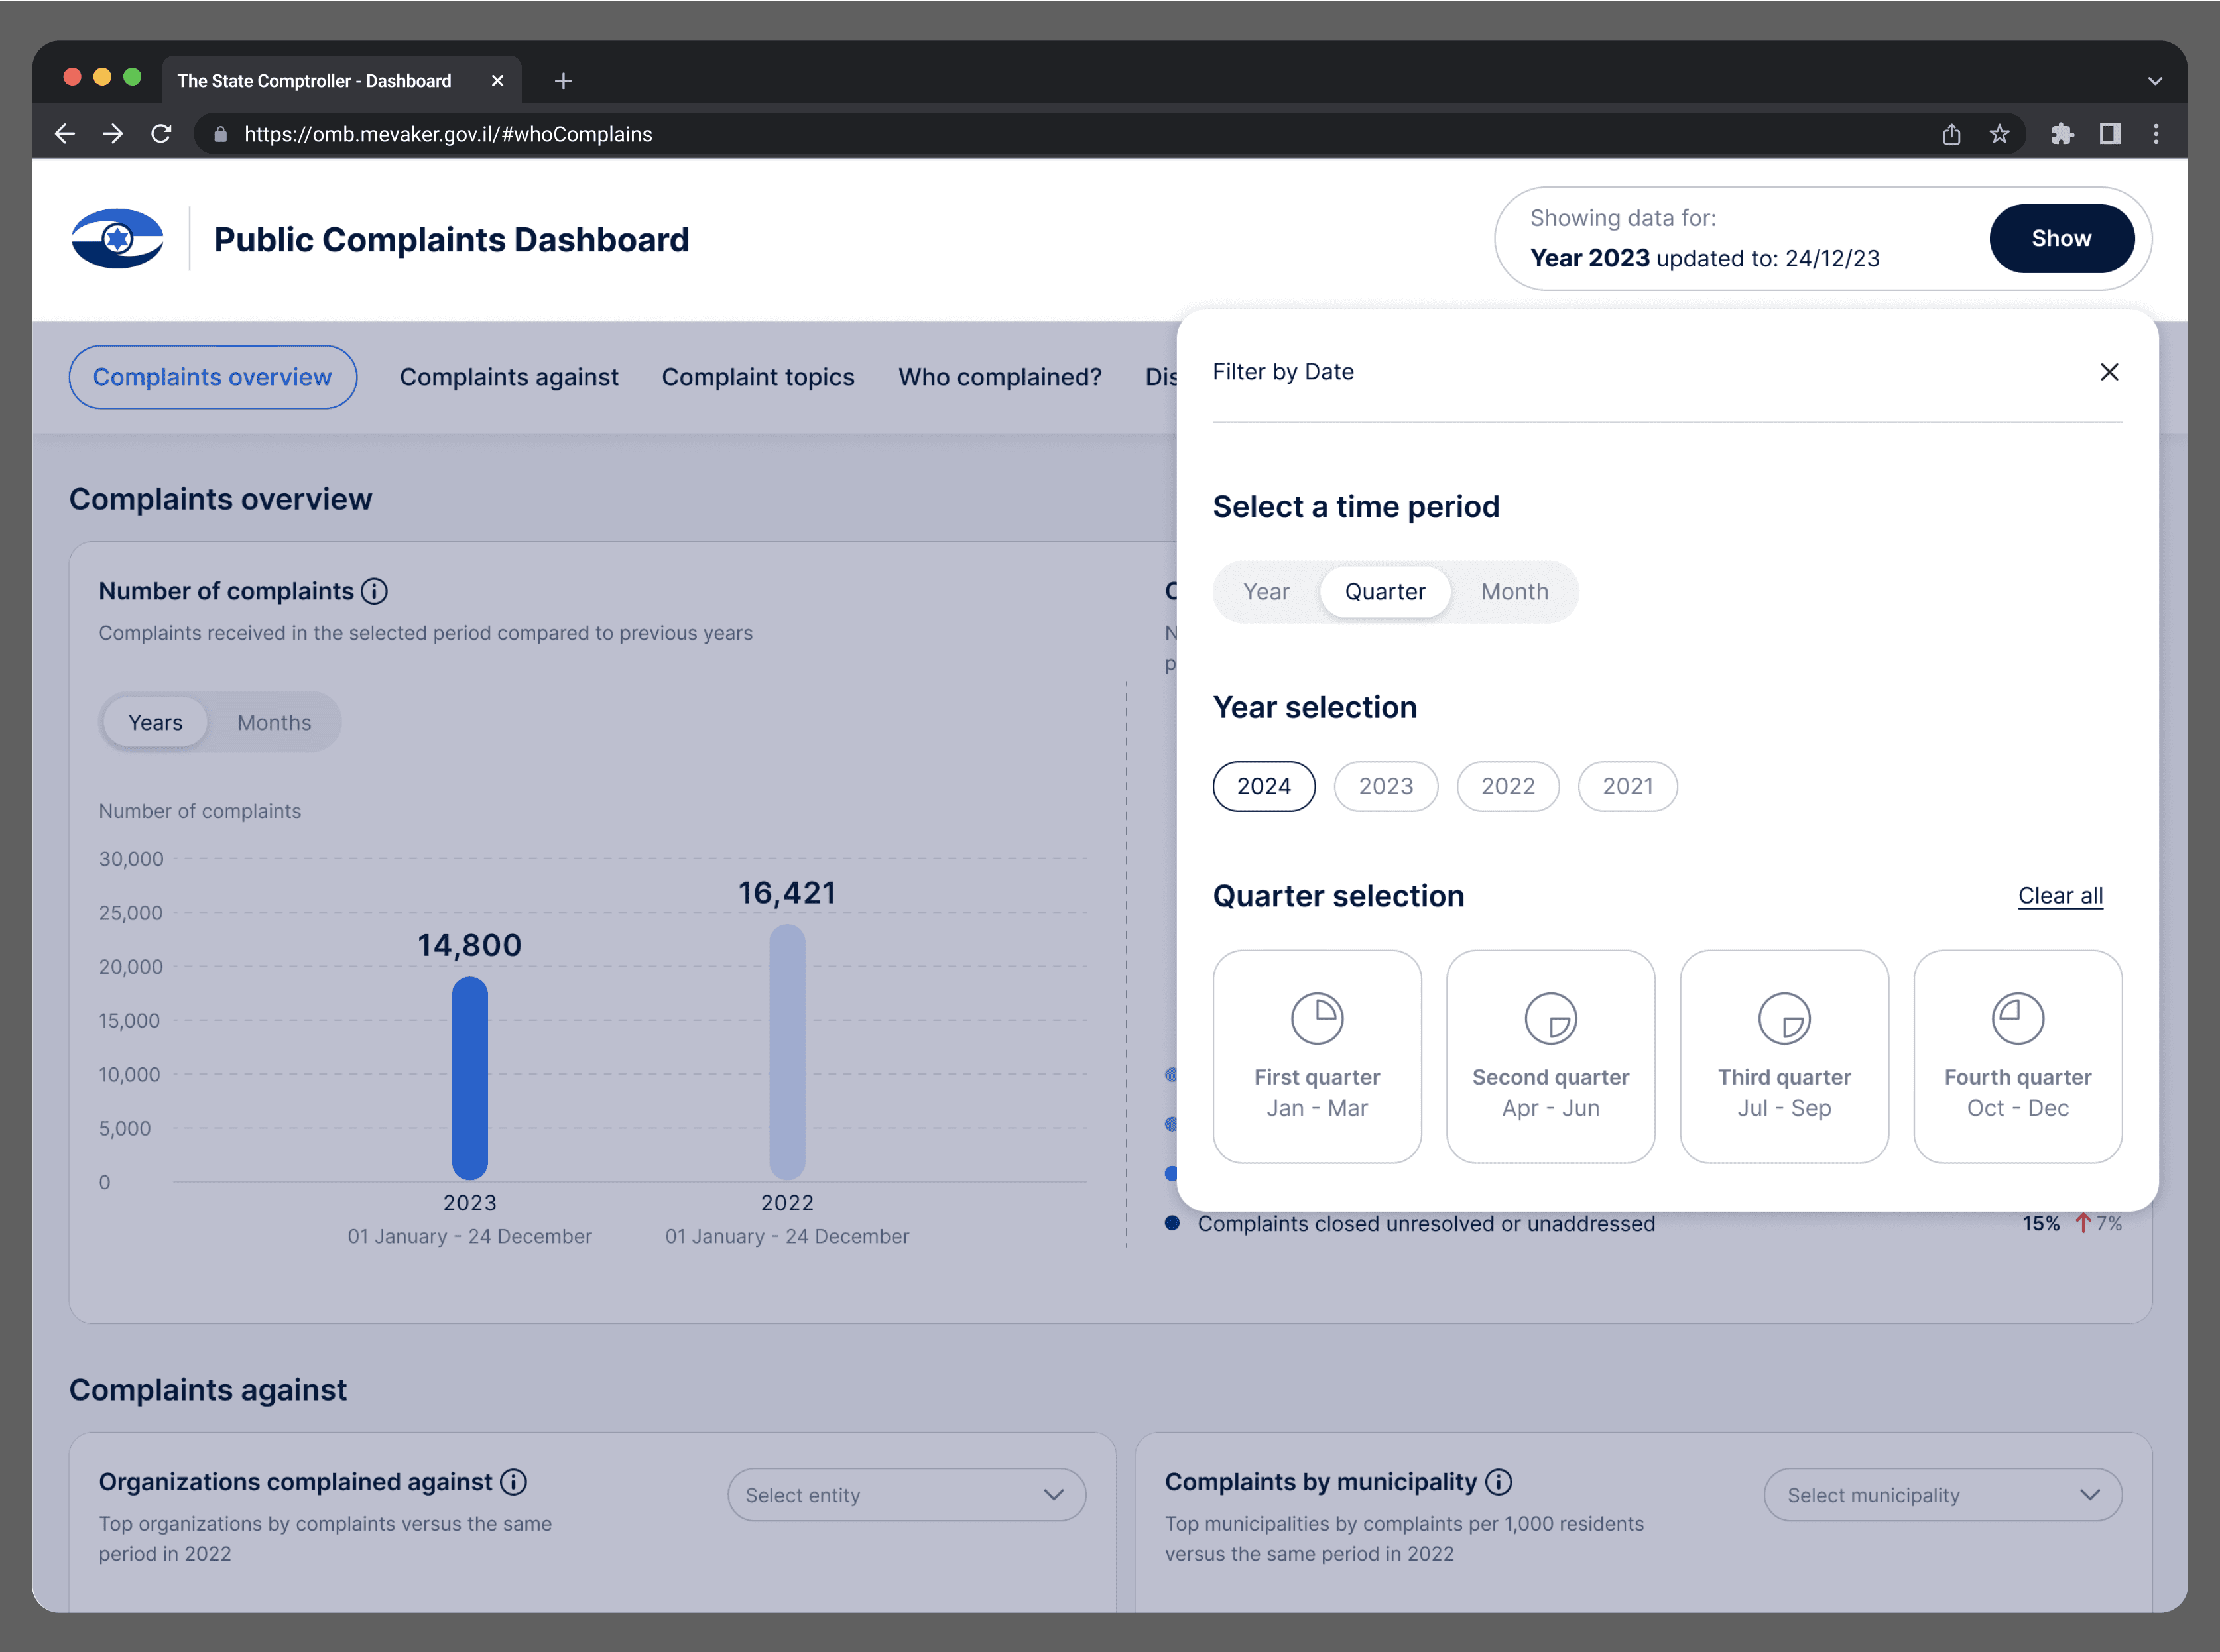
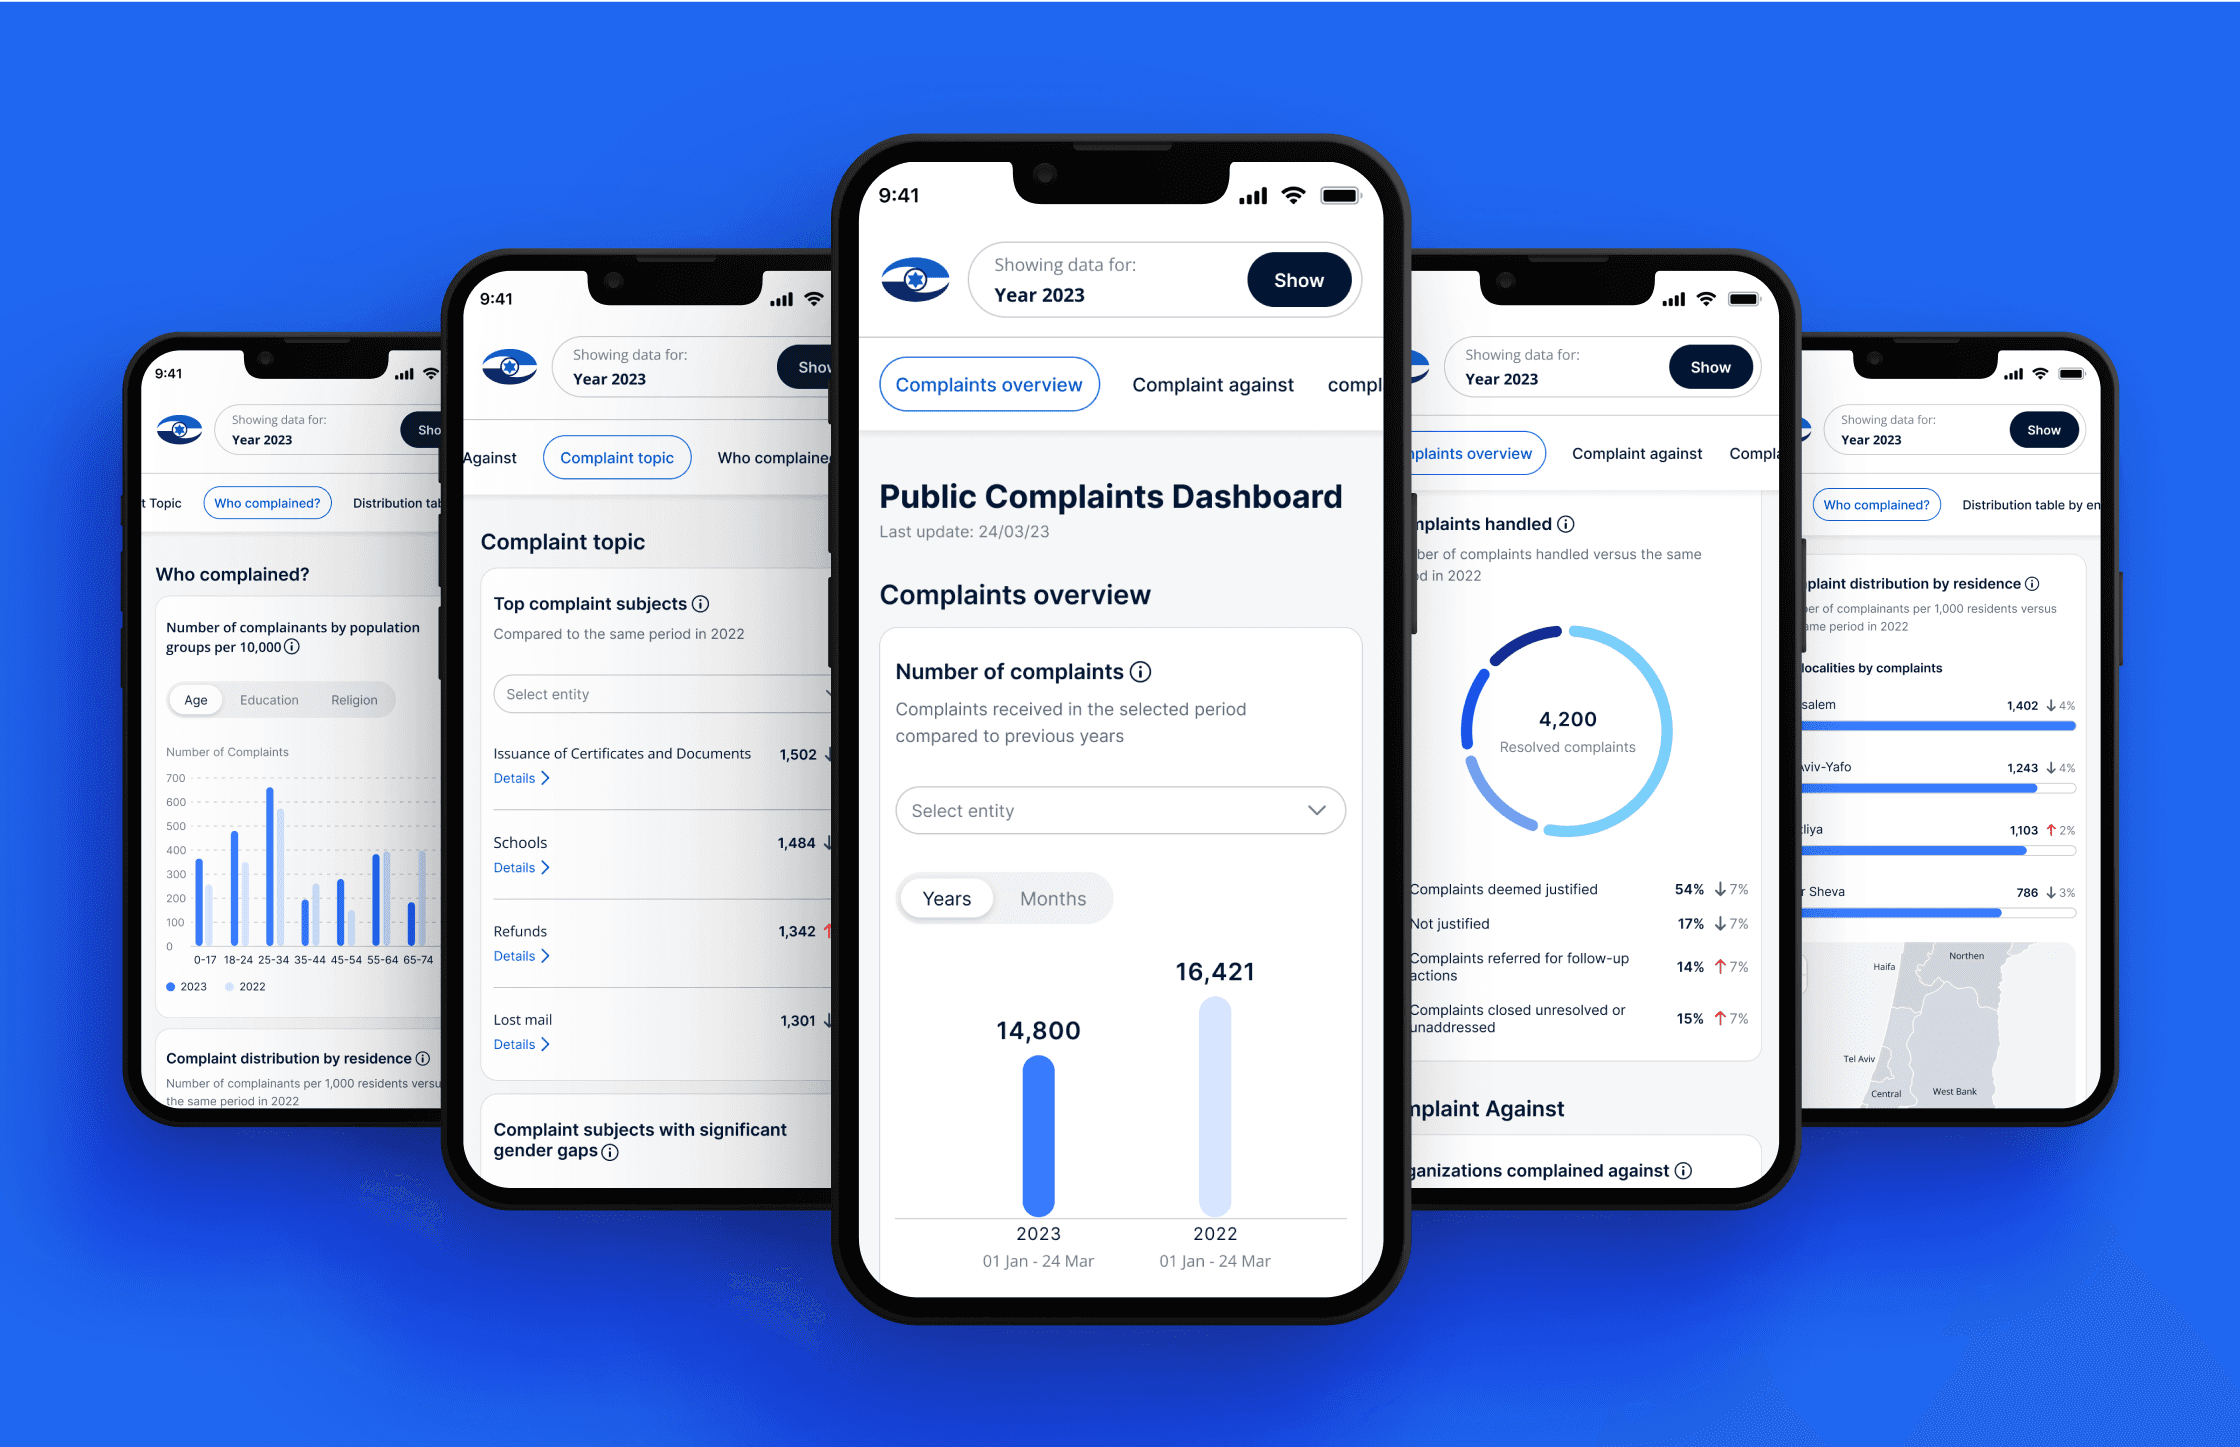
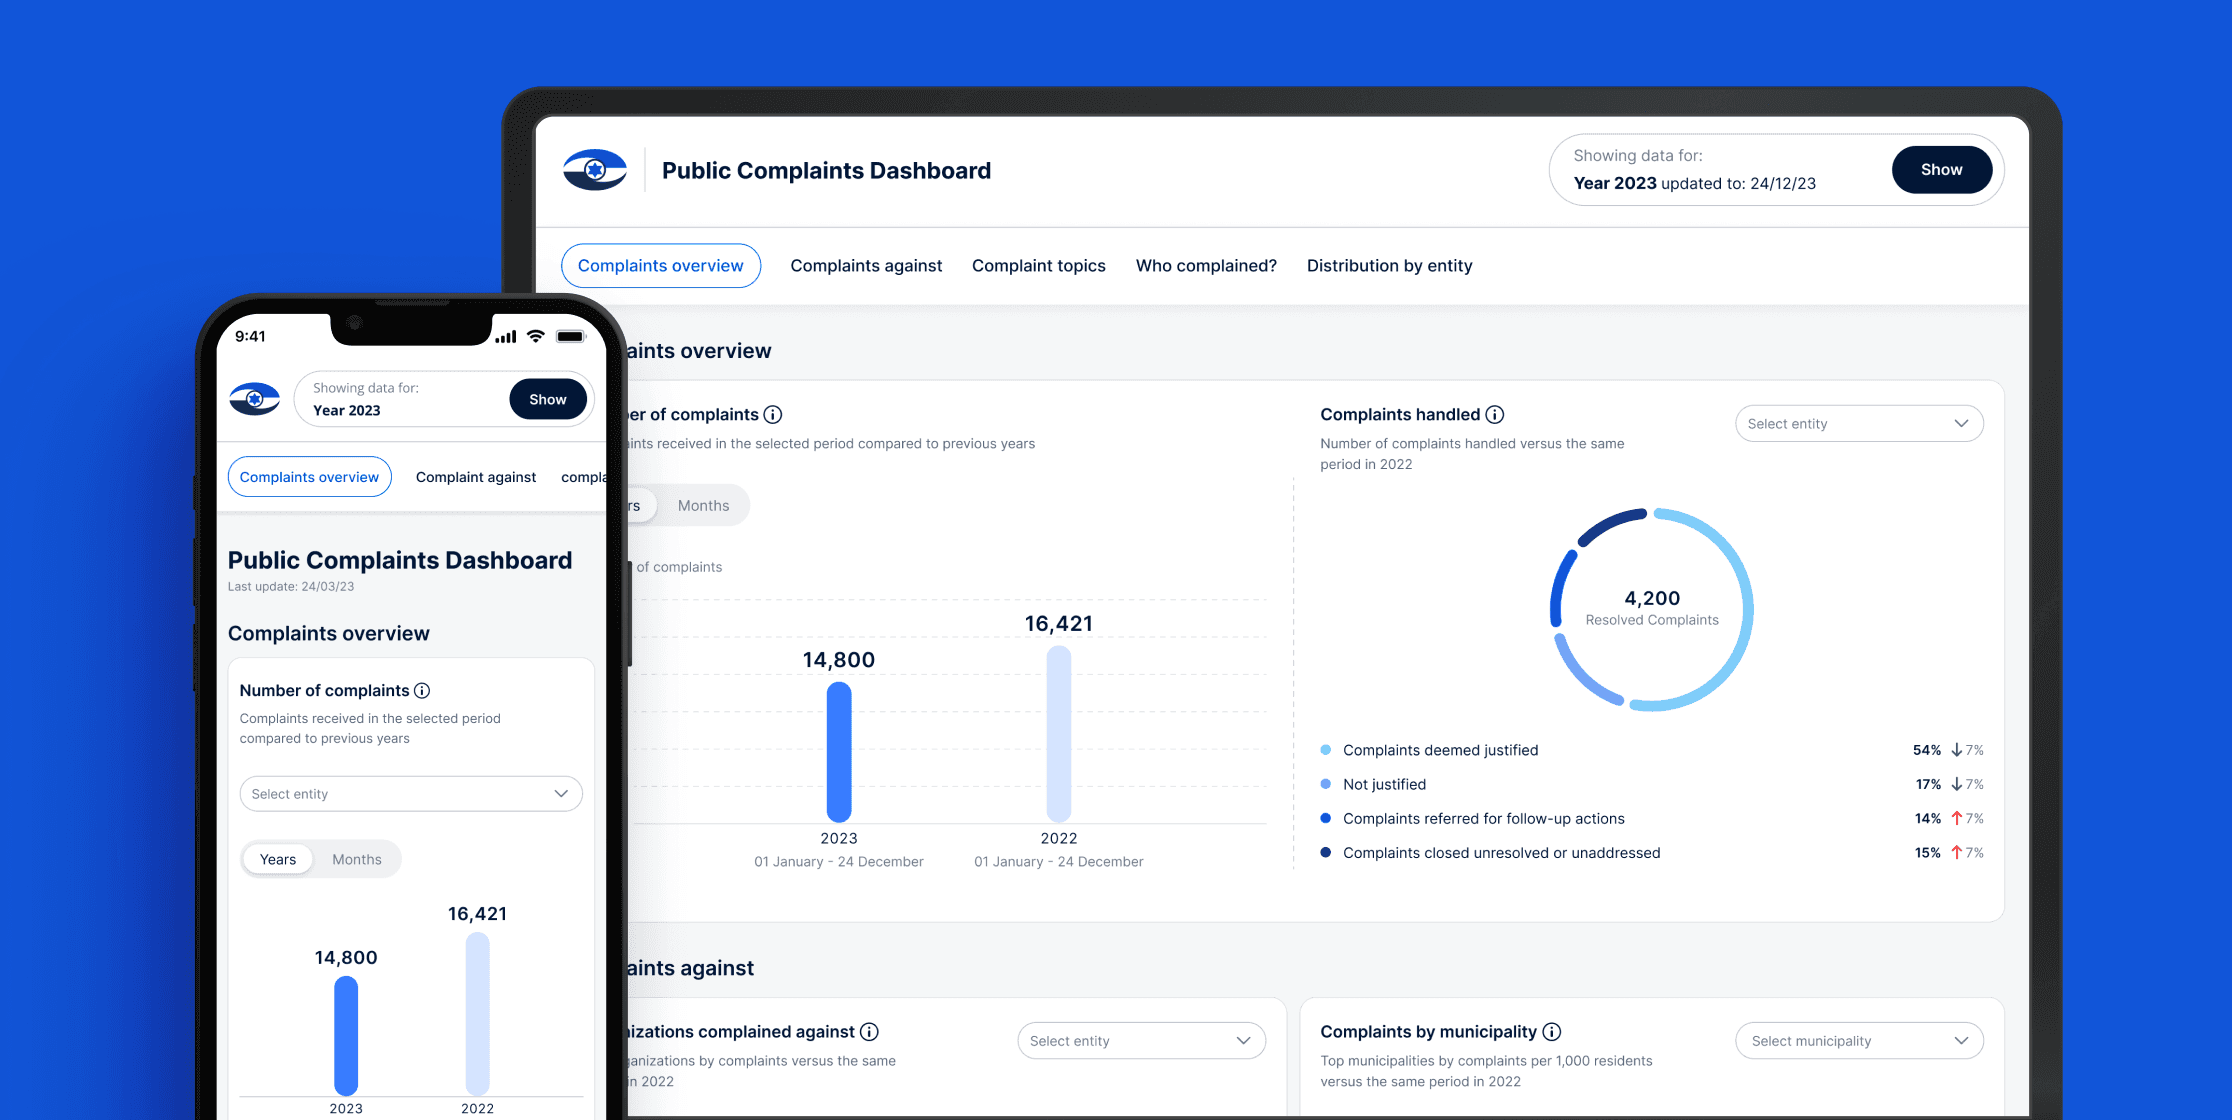
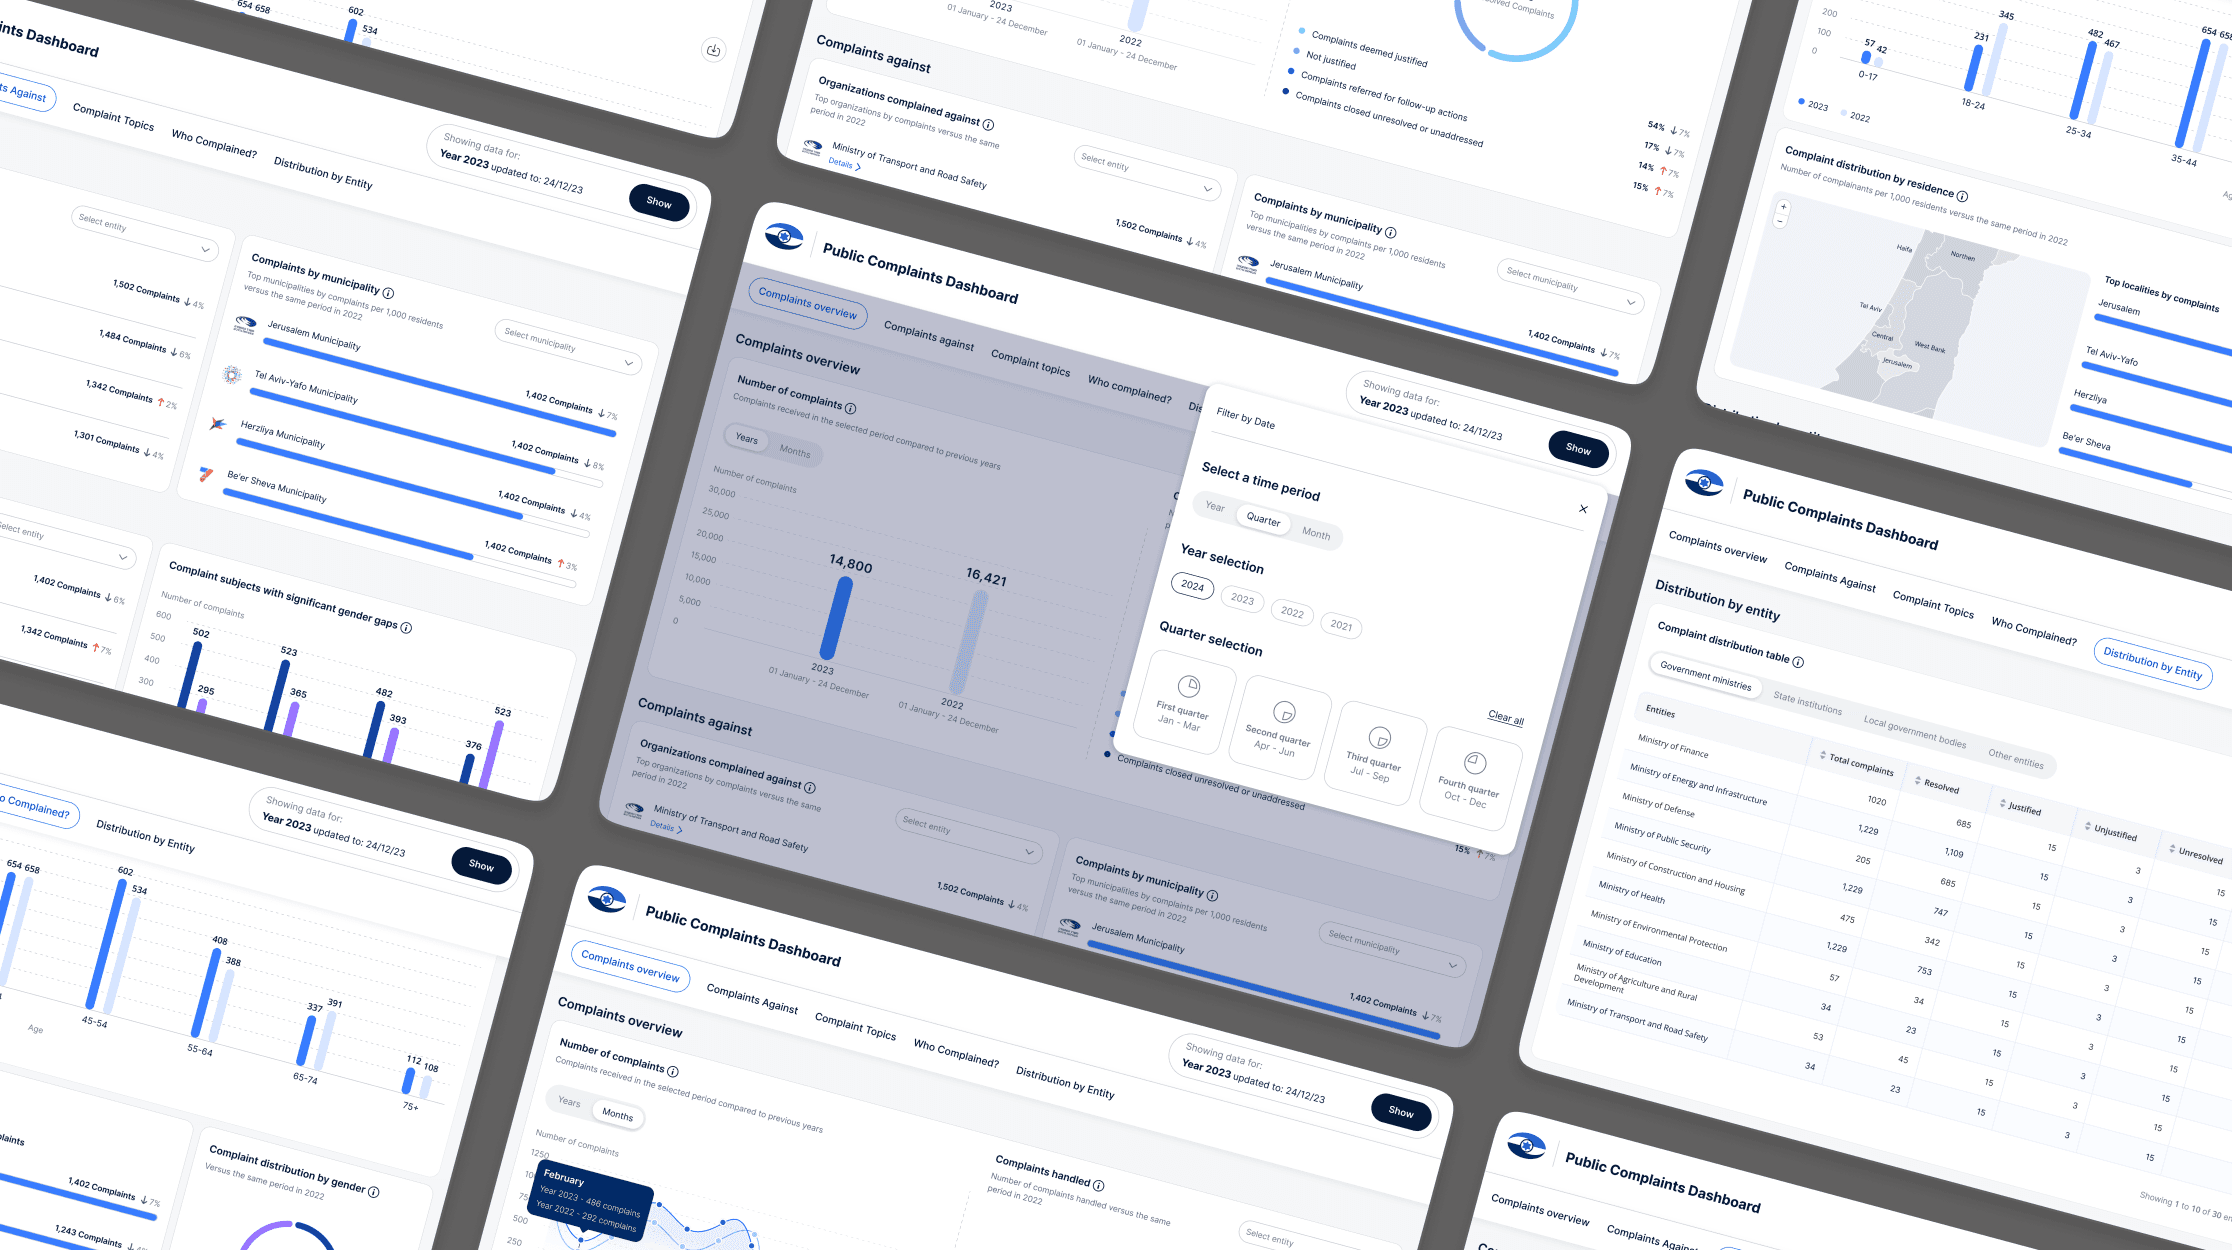
Designed interactive dashboards with filters by complaint topic, location, department, and year.
Created multiple data visualizations: bar charts, pie charts, and line graphs to represent trends and patterns.
Developed a clean, accessible interface that works across screens.
Built a scalable design system to support future modules.
The final platform provided government workers and the public with a centralized and dynamic way to explore complex data. What once took hours of document scanning could now be completed in minutes with just a few clicks. The project was praised for its clarity, usability, and ability to democratize access to critical civic information.